Pipeline forecasts
IN THIS ARTICLE
Pipeline forecasts provides detailed revenue and resourcing insights across your active deals
The forecasts page includes comprehensive metrics such as weighted revenue, capacity, and schedule forecasts that are intelligently calculated based on each deal's probability and status.
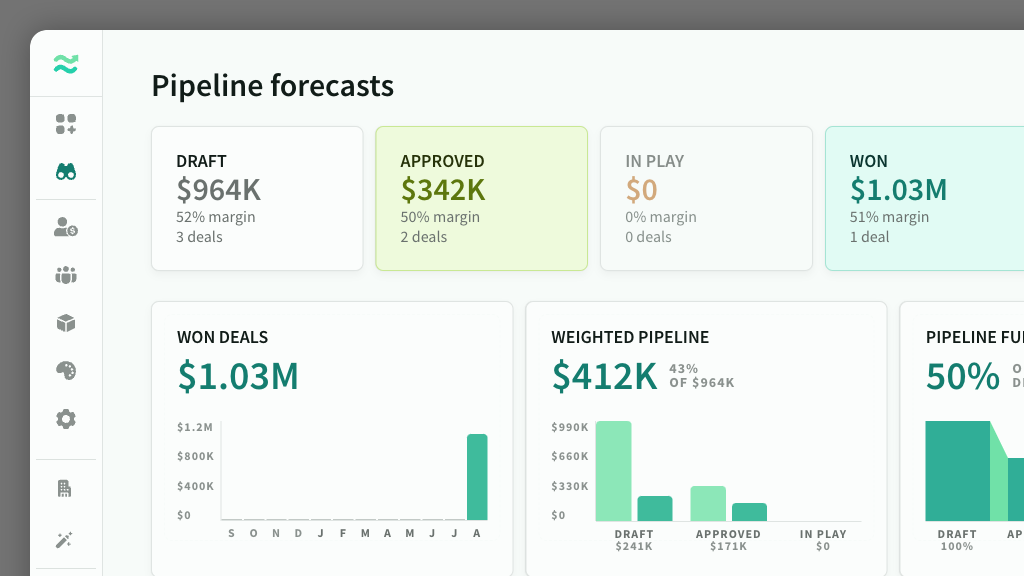
Pipeline stats
At the top of the page is a summary of the value and status of all the active deals in your space grouped by status: draft, approved, in play, lost and won.

Revenue forecasts
The revenue forecasts provide insights into pipeline revenue and win rates, including a review of deals won in the past 12 months, a weighted pipeline revenue based on deal probabilities, and an analysis of the funnel or conversion rates at various stages.

Capacity forecasts
The capacity forecast displays resource projections weighted by deal probability. This chart can be filtered by deals, deal status, resource type, and timescale. This allows for more detailed analysis of pipeline impacts across your open and won deals.
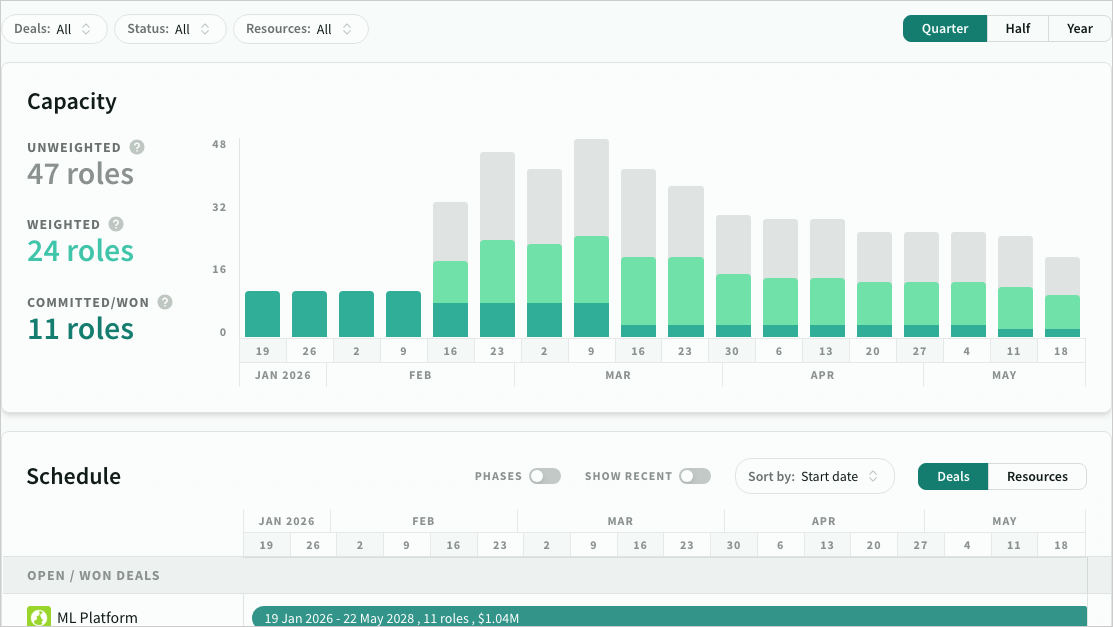
Schedule forecasts
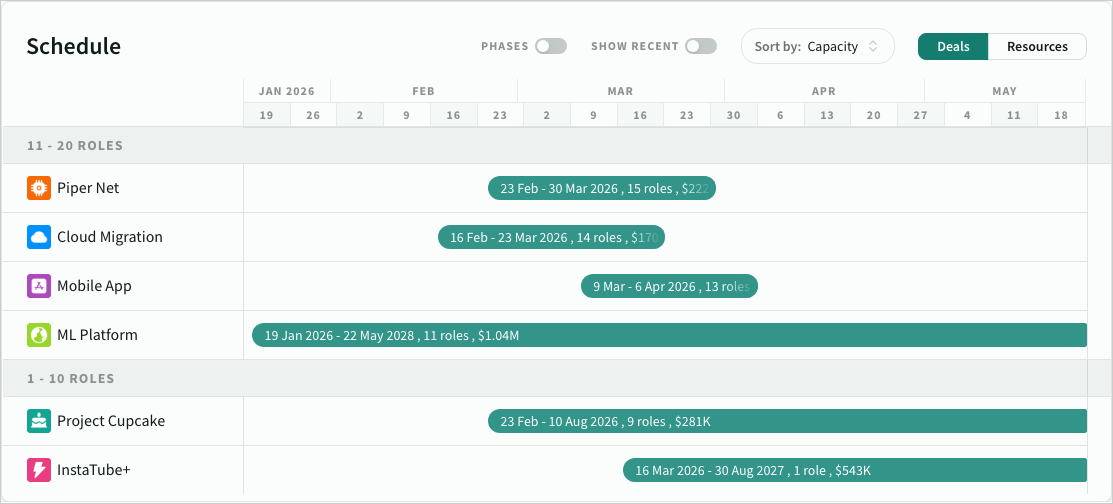
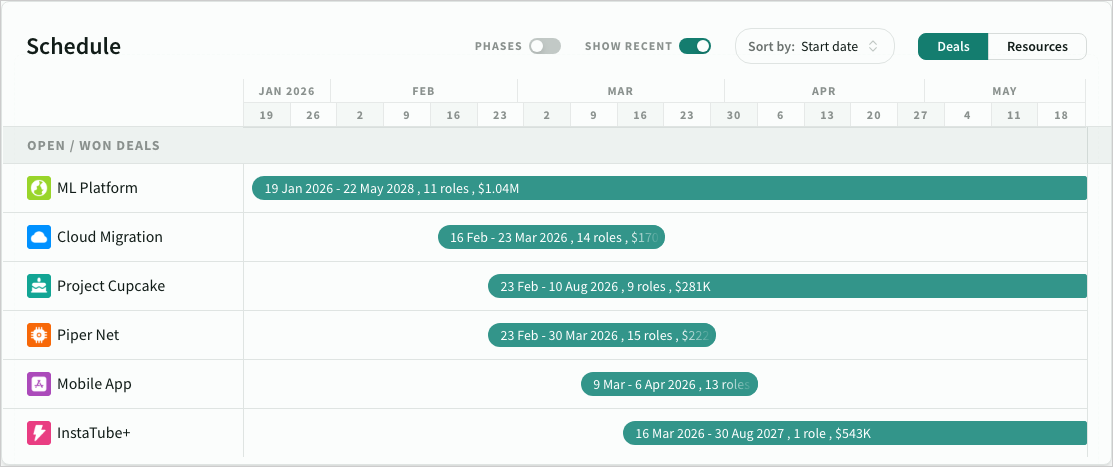
The schedule forecast presents a comprehensive view of all deal timelines, aligned with your chosen capacity filters.
Schedules can be sorted by start date, end date, capacity, deal status or alphabetical, and with/without phases
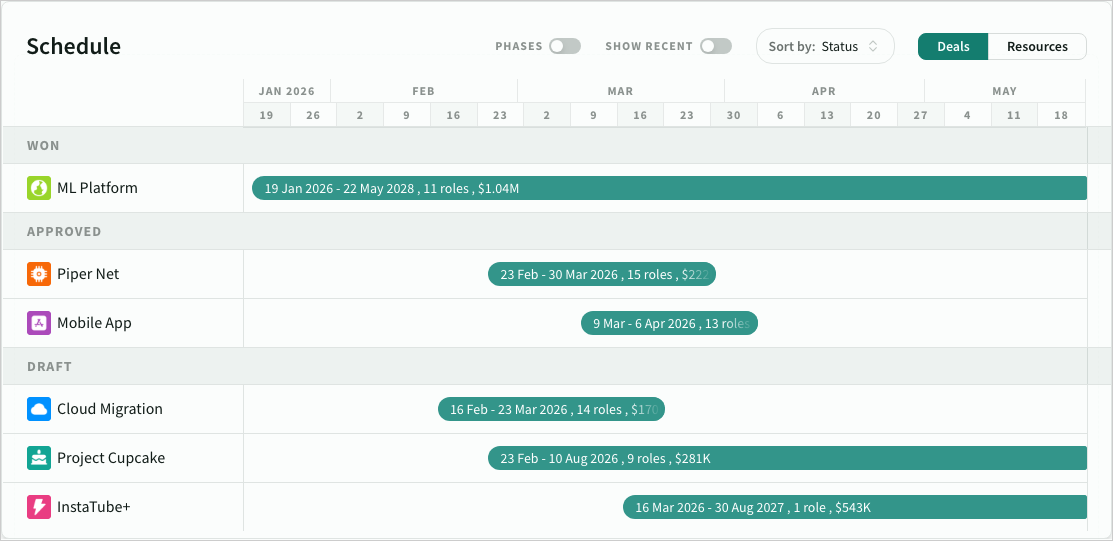
Each deal displays the maximum capacity during the current timescale. Hover over a deal to view more details.
Deals scheduled before the current timescale are hidden by default. You can show them using the show recent toggle.
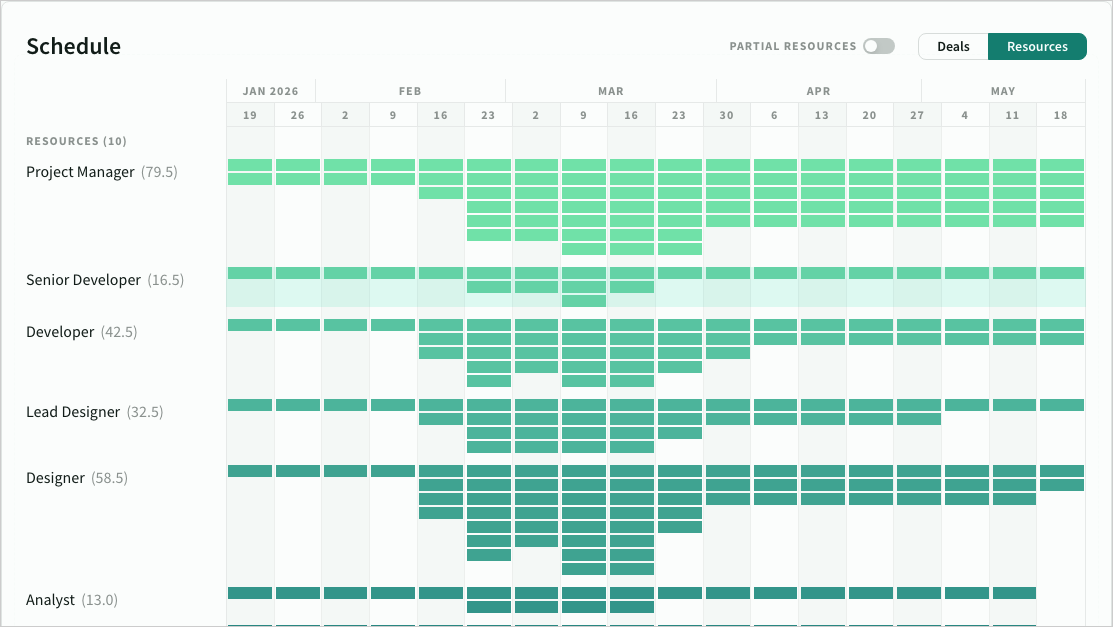
Resource forecasts
The resource forecast presents a comprehensive view of resource demand across projects, aligned with your chosen capacity filters.
Toggle 'partial resources' to highlight resources with less than 100% capacity.
